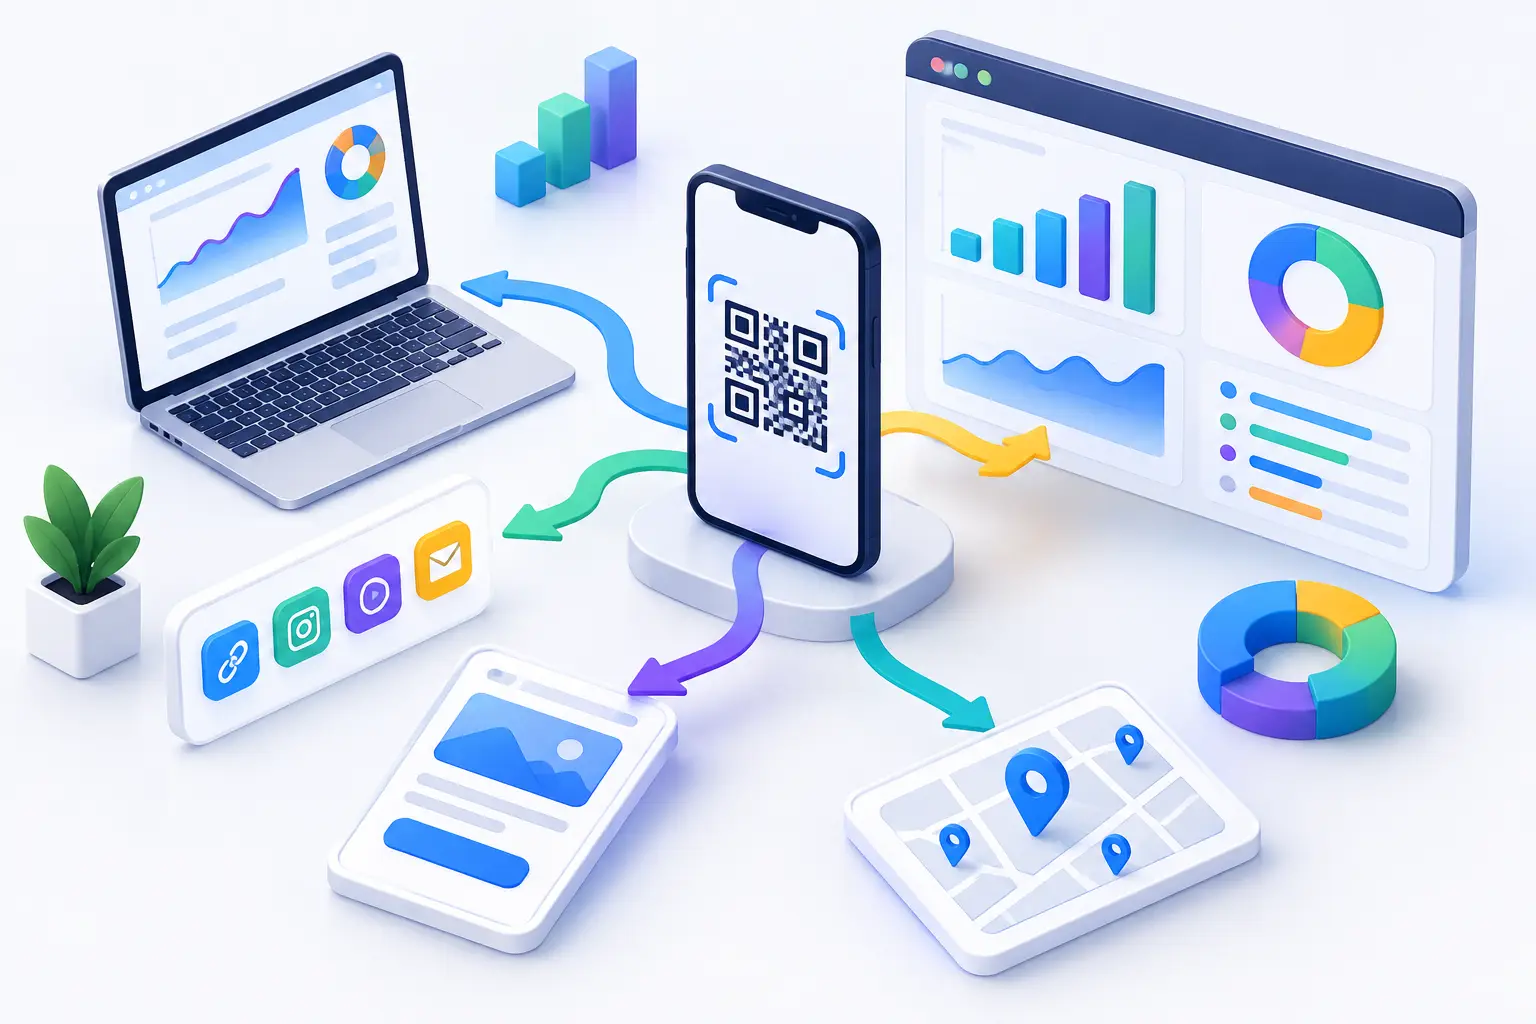
A QR code on a package, postcard, event sign, or retail display can create a measurable path from a physical moment to a digital action. But only if you can tell which code was scanned, where it appeared, what happened after the scan, and whether that action led to revenue. This guide to QR attribution strategy shows how to build that path without relying on guesswork or a generic QR code pasted everywhere.
QR attribution is not simply counting scans. Scan volume is useful, but it is an early signal, not the finish line. A serious strategy connects each physical placement to a campaign, a destination, and the outcomes that matter: leads, signups, product views, purchases, app installs, or qualified conversations.
Why QR attribution breaks down
The most common failure is using one QR code for an entire campaign. A team prints the same code on 10,000 flyers, adds it to a conference booth, and places it in a direct mail piece. The analytics then report a single total. Someone scanned, somewhere, for some reason. That is not attribution.
The second failure is sending every scan to a homepage. A homepage may be technically valid, but it gives the visitor extra work and gives your team less context. A person scanning a code beside a product display should land on that product, offer, or comparison page. A person scanning an event badge should see the event-specific next step.
The third failure is treating QR data as separate from the rest of your marketing data. Offline activity should not live in a spreadsheet that never informs media spend, creative decisions, or conversion analysis. QR codes are campaign entry points. They need the same naming standards, analytics discipline, and ownership as email links, paid social links, and paid search landing pages.
Build your QR attribution strategy around decisions
Before creating a code, identify the decision its data should support. This keeps your tracking system useful instead of overly complicated.
For a retail display, you may want to compare store regions, placement types, or product messaging. For direct mail, the question may be whether a specific audience segment responds better to a discount, a product demo, or a content offer. For events, you may be measuring which session, booth message, or partnership creates qualified follow-up.
Write down one primary outcome and one or two supporting metrics. A product launch code might use purchases as the primary outcome, with scans and product-page engagement as supporting metrics. A lead-generation campaign might prioritize completed forms, then track scans and form-start rate to find where visitors drop off.
This distinction matters because high scan volume can be misleading. A code in a high-traffic location can generate plenty of curiosity without generating meaningful business activity. Conversely, a smaller number of scans from a targeted sales leave-behind may create more qualified opportunities. The better placement depends on your objective.
Guide to QR attribution strategy: create a trackable structure
Every QR code should map to one distinct physical context. That does not always mean one code per individual printed item. It means one code per placement you want to compare.
A clean naming convention makes this manageable. Include the campaign, channel, asset, location or audience, and date range when relevant. For example, a code name such as `spring-launch_direct-mail_austin_offer-a` immediately tells your team what it represents. The public short link can remain concise and branded, while the internal name carries the operating detail.
Your destination URL should include campaign parameters that match your web analytics conventions. Keep the labels consistent across channels. If your team uses `direct_mail` in one campaign and `mailpiece` in another, reporting becomes harder than it needs to be.
Use a structure like this in your planning document:
- Campaign: Spring product launch
- Physical channel: Direct mail
- Asset: Postcard version A
- Audience or location: Austin customer segment
- Destination: Product offer landing page
- Primary conversion: Completed checkout
The code itself should be dynamic whenever possible. A dynamic QR code points to a managed short link rather than permanently embedding a destination URL. If the offer changes, inventory runs out, or a landing page needs correction, you can update the destination without reprinting the asset. That flexibility protects your budget and prevents dead ends after distribution.
Make the landing experience match the scan
A scan is a high-intent micro-moment. The visitor has taken out a phone, opened a camera, and chosen to engage. Do not waste that moment with a slow, generic, desktop-first page.
The landing page should immediately confirm what the scanner is getting. If the QR code says “See the 30-second demo,” show the demo. If it says “Claim your event offer,” show the offer and any deadline. Repeating the physical call to action in the page headline reduces confusion and helps visitors trust that they reached the right place.
Mobile performance matters here. QR traffic is overwhelmingly mobile, so test the page on real devices, not only in a desktop browser. Check load time, form length, button placement, checkout flow, and whether analytics events fire after a scan.
There is also a trust issue. People are more cautious about scanning unfamiliar codes, especially in public places. Branded short links, clear calls to action, and destination safety checks reduce hesitation. AWSYS adds transparent trust scoring and blocks malicious destinations at link creation, which helps teams distribute campaign links with more confidence. #AWSYSCO
Connect scan data to conversion data
A QR platform can tell you when and where a code was scanned, along with signals such as device type, geography, and referrer when available. Your website analytics and CRM should tell the rest of the story: whether that visitor viewed key pages, submitted a form, started a trial, or purchased.
The connection starts with consistent campaign parameters and event tracking. Confirm that your analytics tool records the landing-page visit with the expected source and campaign values. Then confirm that key events carry through the session. For lead forms, capture campaign context alongside the submission so sales or lifecycle teams can see the originating QR campaign without reconstructing it later.
For purchases, measure more than last-click credit. A person may scan a QR code from a catalog, compare options over several days, then return through a bookmarked page or branded search. If you only credit the final visit, the QR placement appears weaker than it was.
Use a practical attribution window based on your buying cycle. A low-cost impulse purchase may justify a short window. A B2B product, higher-consideration purchase, or event-driven sales process may require a longer view. There is no universal number. The useful question is whether the time window reflects how customers actually decide.
Avoid forcing QR into a perfect one-to-one conversion claim when multiple channels are involved. Instead, report both direct conversions and assisted conversions. Direct conversions show immediate action after a scan. Assisted conversions show that QR created or influenced a journey that finished elsewhere. Both can guide investment.
Read the signals that improve the next print run
Once codes are live, start by comparing scan rate, conversion rate, and conversion quality by placement. Scan rate answers whether people noticed and acted on the physical asset. Conversion rate answers whether the destination and offer did their job. Quality may include revenue, lead qualification, demo attendance, or repeat purchase.
When scan rate is low, look at the physical execution before blaming the offer. The code may be too small, poorly placed, low contrast, inaccessible from a comfortable distance, or paired with weak copy. QR codes need a clear reason to scan. “Learn more” is rarely as persuasive as “See colors in your space” or “Get the installation checklist.”
When scans are strong but conversions are weak, inspect the handoff. The offer may not match the printed promise, the page may load slowly, or the form may ask for too much too soon. It can also mean the placement generates curiosity rather than purchase intent. That is not automatically bad, but it should change how you value the code.
Location comparisons often reveal practical lessons. A code near a checkout counter may produce fewer scans than one on product packaging, but a higher purchase rate. A conference code displayed during a talk may spike briefly, while a code on a takeaway card may generate slower, more deliberate follow-up. Keep both timing and context in the analysis.
Test QR campaigns without losing attribution
Testing works best when you change one meaningful variable at a time. Run separate QR codes for different calls to action, offers, creative versions, or placements. Do not send them all through the same link if you want an answer about performance.
A useful test might compare “Book a demo” against “Get the buyer’s checklist” at the same event. Another might compare a product-specific destination against a category page on identical shelf signage. Give each variation enough exposure before making a decision. A few scans can indicate interest, but they rarely support a budget shift.
Be careful with over-segmentation. Creating unique codes for every individual poster can produce more data than insight, especially at low volume. Track at the level where you can take action. If you can move budget by city, compare cities. If you only control the national creative, track creative versions rather than every store location.
A QR code becomes valuable when it turns physical attention into an accountable digital signal. Start with the decision you need to make, give each placement its own measurable path, and keep improving the experience after the scan. Your next printed campaign should not merely look trackable. It should tell you exactly what to do next.